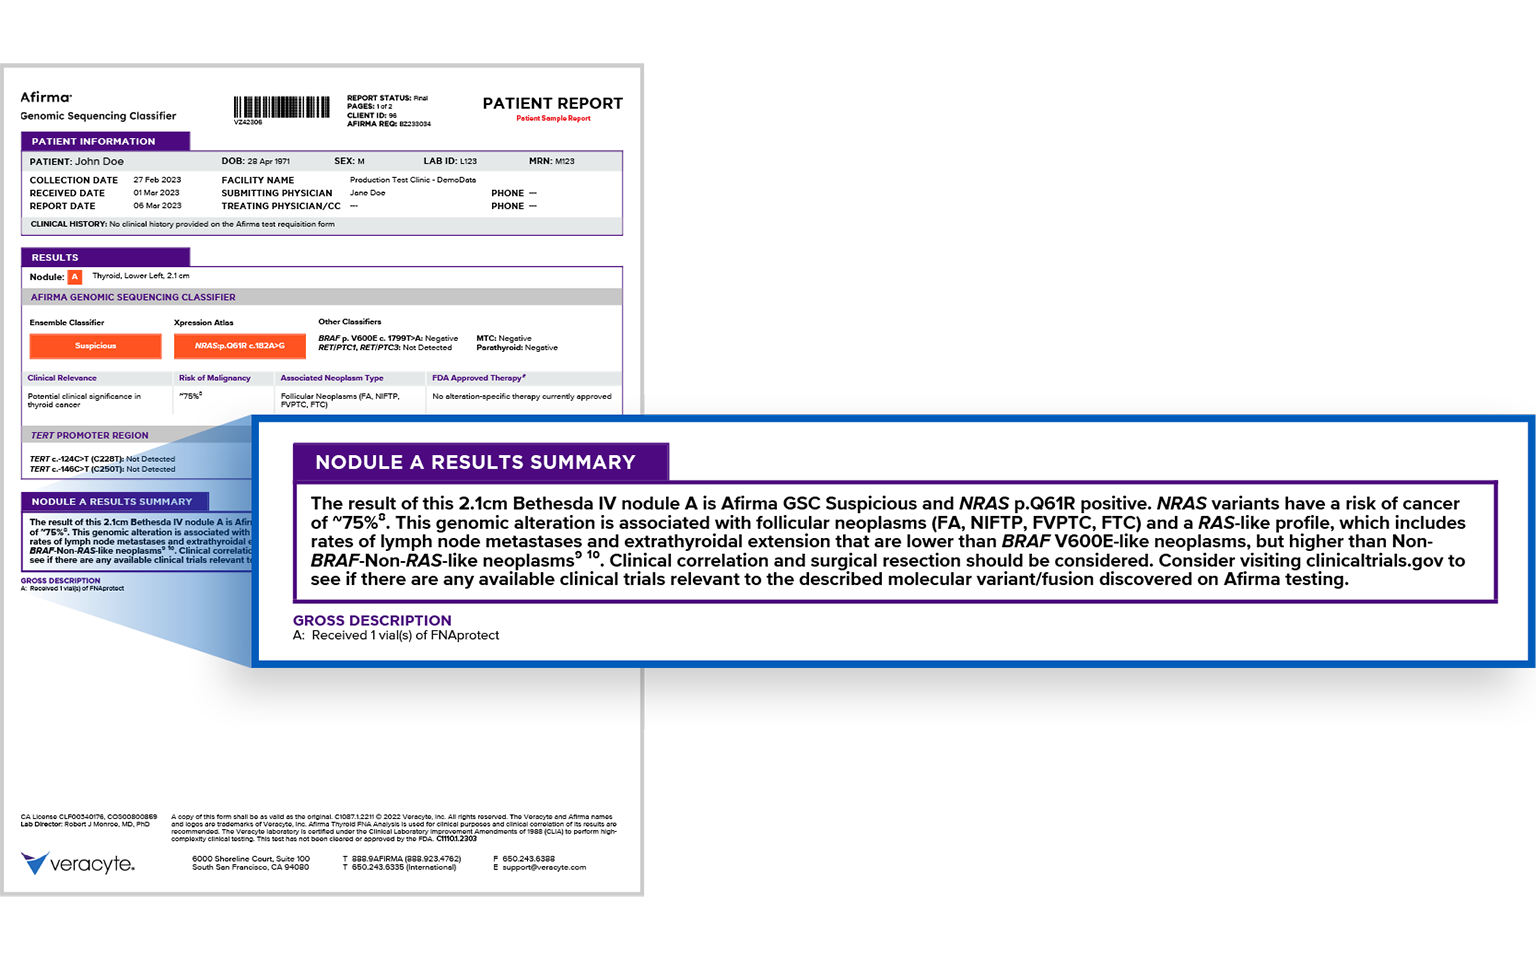
You may have seen references to “BRAF-like”, “RAS-like”, or “Non-BRAF-Non-RAS ” alterations in the Afirma GSC patient report. Shown below is the Results Summary section of a patient report with NRAS p.Q61R detected. Note how it describes the tumor as exhibiting a “RAS-like profile”:
But what does this mean? BRAF-like, RAS-like, and Non-BRAF-Non-RAS are three different molecular profiles that describe different types of tumor behavior.
Cancer Genome Atlas Network, Cell, 2014.
The BRAF-like and RAS-like profiles were first conceived in 2014, when the Cancer Genome Atlas developed a 71-gene signature to classify alterations into one of two categories: as having either “BRAF– like” or “RAS-like” gene expression.1 This was done by investigating 391 Papillary Thyroid Cancers, which often have two mutually exclusive cancer drivers (BRAFV600E and mutated RAS) and assigning a BRAFV600E – RAS Score (BRS).
Yoo et al, PLoS Genetics, 2016.
Yoo et al expanded on this 2 years later to include follicular thyroid cancers, follicular adenomas, and add one more molecular subtype: “non-BRAF-non-RAS” (NBNR).2
Tang AL, et al, Endocrine Practice, 2020.
The table below shows how several genomic alterations would be organized into the different molecular classes:3
Tumor behavior by molecular profile
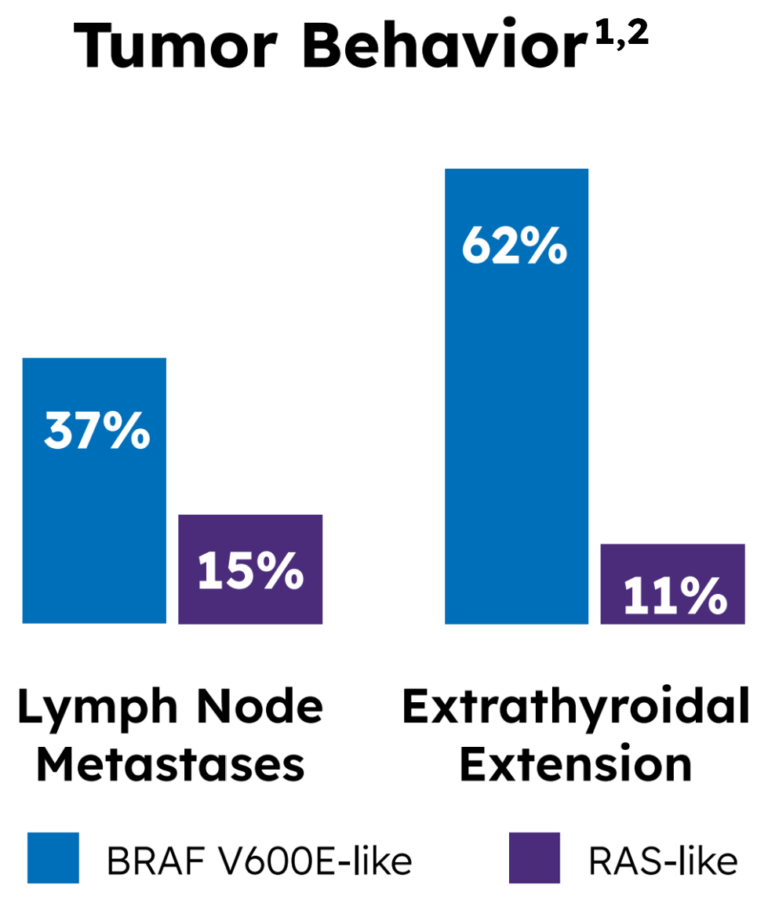
Yoo also provided insight into potential tumor behavior: a higher frequency of lymph node metastases was found in 37% of the BRAF-like group, compared to 15% of the RAS-like group. Similarly, a higher frequency of extrathyroidal extension was found in 62% of the BRAF-like group, compared to 11% of the RAS-like group.1,2
It’s very important to note, however, that none of the values above reach 100%. While the different molecular profiles tend to correlate to different tumor behaviors, this is at a population level that does not take individual variability into account.
Conclusion
Cancer development is incredibly complex, and often is not caused by a single mutation. This is one of the reasons why Afirma GSC uses whole-transcriptome-derived analysis: it allows us to go beyond the variants to characterize nodules further. If you’re interested in conducting research of your own or would like to learn more about Afirma GSC, fill out the form below and a genomic specialist will be in touch with you shortly.
Tags
Scientific Insights
Thyroid Cancer
Afirma Thyroid